Ruby memory leak trackdown
Contents |
Memory a Boot
https://github.com/schneems/derailed_benchmarks
# Gemfile
gem 'derailed_benchmarks'
Memory used at require time
bundle exec derailed bundle:mem
TOP: 80.0586 MiB
  activeadmin_settings_cached: 20.207 MiB
    activeadmin_settings_cached/engine: 20.207 MiB

# to check on heroku
heroku run CUT_OFF=3 bundle exec derailed bundle:mem
Dynamically check for memory usage:
bundle exec derailed exec --help
  $ derailed exec perf:allocated_objects  # outputs allocated object diff after app is called TEST_COUNT times
  $ derailed exec perf:app  # runs the performance test against two most recent commits of the current app
  $ derailed exec perf:gc  # outputs GC::Profiler.report data while app is called TEST_COUNT times
  $ derailed exec perf:heap  # heap analyzer
  $ derailed exec perf:ips  # iterations per second
  $ derailed exec perf:library  # runs the same test against two different branches for statistical comparison
  $ derailed exec perf:mem  # show memory usage caused by invoking require per gem
  $ derailed exec perf:mem_over_time  # outputs memory usage over time
  $ derailed exec perf:objects  # profiles ruby allocation
  $ derailed exec perf:stackprof  # stackprof
  $ derailed exec perf:test  # hits the url TEST_COUNT times
For example
# for example
TEST_COUNT=5000 bundle exec derailed exec perf:mem_over_time
# if it is increasing than there is a memory leak

# use different path than root '/'
PATH_TO_HIT=/api/p=123a bundle exec derailed exec perf:mem_over_time
See where objects are created
$ env ALLOW_FILES=codetriage bundle exec derailed exec perf:objects
Gem memory profiler
You can run this in heroku console to check difference in memory before and after some code
require 'memory_profiler'

MemoryProfiler.start

# run your code

report = MemoryProfiler.stop
report.pretty_print
Rack memory profiles
Gem rack-mini-profiler https://github.com/MiniProfiler/rack-mini-profiler
I add simple widget on top left corner of the page when it is server side
render. Does not work when render json: data (it has to be html).
Add to your gemfile
# for profiling memory and sql
gem 'rack-mini-profiler'
Additional gems
gem 'flamegraph'
gem 'stackprof' # ruby 2.1+ only
gem 'memory_profiler'
By default it is enabled in development mode
# config/initializers/rack_profiler.rb
Rack::MiniProfiler.config.authorization_mode = :whitelist
To enable for specific users you need to
# app/controllers/application_controller.rb
  before_action :enable_rack_miniprofiler_for_admin

  def enable_rack_miniprofiler_for_admin
    if current_user && Rails.application.secrets.admin_emails.include?(current_user.email) && params[:profiler] == "true"
       Rack::MiniProfiler.authorize_request
    end
  end
System memory
In any ruby code you can use this snippet
# config/initializers/memory_profiler.rb
# Show current process memory in log. Creat memory.log with
# tail log/production.log -f | grep -o MEMORY.* --line-buffered | tee log/memory.log
# if you are using *rails_12factor* gem than log is in STDOUT instead of log/production.log
# and export RAILS_SERVE_STATIC_FILES=true
if Rails.application.secrets.memory_profiler
  Thread.new do
    Kernel.loop do
      pid = Process.pid
      rss = `ps -eo pid,rss | grep #{pid} | awk '{print $2}'`.to_i # size in KB
      rss = ActionView::Base.new.number_to_human_size rss * 1.kilobyte
      objects = GC.stat[:heap_live_slots]
      objects = ActionView::Base.new.number_to_human objects
      Rails.logger.info "MEMORY[#{pid}]: time: #{Time.zone.now} rss: #{rss}, live_objects: #{objects}"
      sleep 2
    end
  end
end
# config/secrets.yml
  # memory profiler
  memory_profiler: <%= ENV["MEMORY_PROFILER"] || false %>
You can use get_process_mem gem
but it would be the same number as this rss local value. Note that those are
kilobytes.
GC.stat[:heap_live_slots] is not available before ruby 2.1.
It’s good to have similar env as on production, so it’s better to dump database and run in production mode than to create fake seed data.
You don’t need to download database if you can deploy and download memory log.
On heroku you can use heroku logs -t | tee log/production.log or just download
if you some log service enabled (like Logentries).
Heroku has plugin labs that show memory in logs https://devcenter.heroku.com/articles/log-runtime-metrics
heroku labs:enable log-runtime-metrics
source=web.1 dyno=heroku.2808254.d97d0ea7-cf3d-411b-b453-d2943a50b456 sample#load_avg_1m=2.46 sample#load_avg_5m=1.06 sample#load_avg_15m=0.99
You can see which pages are most used by greping only GET requests, -o
is only, s/ is supstitute, -v don’t include auth pages.
grep -o 'Started GET ".*" for' log/development.log |
sed 's/Started GET "/http:\/\/localhost:3000/' |
sed 's/" for$//' |
grep -v auth |
tee urls.txt
Plotting on png
To plot data you need to grep specific format to create log/memory_profile.log
and to run gnuplot lib/memory_profile.gp
and open image with gnome-open tmp/memory_profile.png. If your
image viewer does not automatically refresh, you open image in firefox firefox
./tmp/memory_prifile.png or using feh --reload 2 tmp/memory_profile.png
tail log/development.log -f | grep -o MEMORY.* --line-buffered | tee log/memory_profile.log | gnuplot lib/memory_profile.gp

# or my function
show_memory
# lib/memory_prifile.gp
#!/usr/bin/gnuplot

# to see image, run with:
# gnuplot docs/memory_profile.gp
# gnome-open tmp/memory_profile.png

reset
set terminal png
set output "tmp/memory_profile.png"

set xdata time
set timefmt "%Y-%m-%d %H:%M:%S"
set format x "%H:%M"
set xlabel "time"

set ylabel "memory"
set y2label "heap_live_objects"
#set yrange [0:1000000]
set y2tics

set title "rss"
set grid
set style data linespoints

plot "log/memory_profile.log" using 3:7 with lines title "rss", \
  "" using 3:9 with lines lc rgb 'blue' title "heap_live_objects" axes x1y2

pause 5
reread
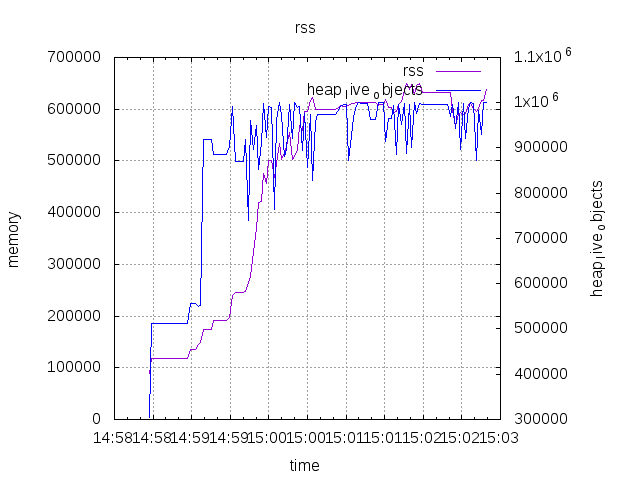
You can see that live objects (blue line) goes up and down, and memory rss is usually increasing (around 600MB)
Tutorials
videos Goruco 2010 Aman Gupta: memprof https://vimeo.com/12748731 Goruco 2014 Aaron Quint: ruby perfomance tooling https://www.youtube.com/watch?v=cOaVIeX6qGg Rocky Mountain Ruby 2014, Hemant Kumar, RBKit https://www.youtube.com/watch?v=hcaYjiAIres
blog post from github https://github.com/blog/1475-escape-velocity
types = Hash.new(0)
ObjectSpace.each_object do |obj|
types[obj.class] += 1
end
pp types.sort_by { |klass,num| num }
./bin.rbtrace -p 8963 -e 'GC.start(full_mark: true); require "objspace";\
ObjectSpace.dump_all( output: File.open("heap.json","w"))"
http://blog.codeship.com/debugging-a-memory-leak-on-heroku/
Discourse
- http://samsaffron.com/archive/2013/11/22/demystifying-the-ruby-gc
- benchmarking localy https://meta.discourse.org/t/benchmarking-discourse-locally/9070
About GC Garbage collector
Helpers
We will use those helpers
def gc_stat_for(property = :total_freed_objects)
  init = GC.stat(property)
  yield
  GC.stat(property) - init
end

def mem
  `ps -eo pid,rss | grep #{$PID} | awk '{print $2}'`.to_i * 1.kilobyte
end

def gc_start(options = { full_mark: true, immediate_sweep: true })
  GC.start options
end

def h number
  ActionController::Base.helpers.number_to_human number
end

def hs number
  ActionController::Base.helpers.number_to_human_size number
end
Allocated memory is slowly released
Allocated memory of ryby process in practice is never decreasing. Once is allocated, GC can clear it but it will not return to the OS. It will stay referenced for that ruby proccess some time. So if one request makes a lot of objects, memory will stays big and you will be charged for that memory until process dies. So advice is to find those requests and optimize them (pagination).
For example, if we stop GC and allocate a bunch or arrays but do not return them from method, than memory will stay the same before and after we GC.start.
Note that to actually allocate memory.
gc_start
GC.disable

def make_objects
  non_return_array = []
  1.upto(1_000_000).each { |i| non_return_array << "#{i}" }
  return nil
end
make_objects

GC.enable
before = GC.stat[:total_freed_objects]
gc_start
after = GC.stat[:total_freed_objects]
h after - before
hs mem
# we can see that objects are freed but process still has a lot of memory
Initial GC
There is slight memory backlog before GC starts.
You can manually rub GC with GC.start. Than you can see that in first
iteration, not all MB is free,
GC.start
gc_stat_for { 1_000_000.times { local = "asdf" } }
# => "727 Thousand"
gc_stat_for { 1_000_000.times { local = "asdf" } }
# => "1 Million"
GC commands
GC.enableGC.disable-
GC.start full_mark: true,immediate_sweep: true GC.stat[:total_allocated_objects]GC.stat[:total_freed_objects]number of objects that are GC-edGC.stat[:heap_live_slots]
Server loading
For ajax requests, you need to set -H 'Content-Type:application/javascript;'
(I don’t know why this does not work on rails).For logged in users you need to
set -H 'Cookie: asd=asd' where asd is keys which you can find in Chrome ->
Chrome developer tools -> tab Resources -> submenu Cookies -> localhost -> very
big name (~127 chars) and value (~542 chars)
Simulate load
ab -n 500 -c 5 -C 'asd123=asd123' http://yourapp.com/
also
sudo hping3 -c 10000 -d 120 -S -w 64 -p 21 --flood --rand-source scuddle-staging.herokuapp.com
Tips
-
in-place modification is faster since it does not create new objects
e.downcase.gsub # in place is faster e.downcase! e.gsub! -
limit number of columns that you retrieve from db
Post.all.select [:id, :name] Post.all.joins(:comments).select("posts.name", "comments.body") Post.find_in_batches -
do plain sql to retreive array instead of ActiveRecord (3x size of data, and allocate 2 objects per data value)
ActiveRecord::Base.connection.execute("...") -
kill ruby process if it takes more than 200MB since GC will take more than 100ms to run video
TODO
http://thorstenball.com/blog/2014/03/12/watching-understanding-ruby-2.1-garbage-collector/
TTM1
- http://tmm1.net/
- http://tmm1.net/ruby21-rgengc/
How rails show fixes in memory
- https://github.com/rails/rails/pull/21523
Slow request logger
CLI tool https://github.com/wvanbergen/request-log-analyzer
request-log-analyzer log/production.log
Unmaitained https://github.com/barttenbrinke/munin-plugins-rails https://github.com/moove-it/rack-slow-log
Using shopify tools https://shopify.engineering/how-fix-slow-code-ruby like https://github.com/Shopify/app_profiler
Links
- rblineprof
- stackprof replacing perftools
- stackprof-remote allocation_tracer
ruby-prof https://github.com/tmm1/rbtrace
http://blog.skylight.io/hunting-for-leaks-in-ruby/ http://www.slideshare.net/engine_yard/debugging-ruby
http://www.linuxatemyram.com/play.html https://tunemygc.com/configs/f4179cc82e52ba59155dc285802e0a89
videos
https://medium.com/rubyinside/how-we-halved-our-memory-consumption-in-rails-with-jemalloc-86afa4e54aa3 http://www.be9.io/2015/09/21/memory-leak/ http://eng.rightscale.com/2015/09/16/how-to-debug-ruby-memory-issues.html?
https://ruby-prof.github.io/